
Know what is working. Know what is costing you.
The daily total is only the start. Abridyn turns your completed trades into a clearer performance review, with the metrics, curves and breakdowns you need to ask better questions about your execution.
Request beta access ↗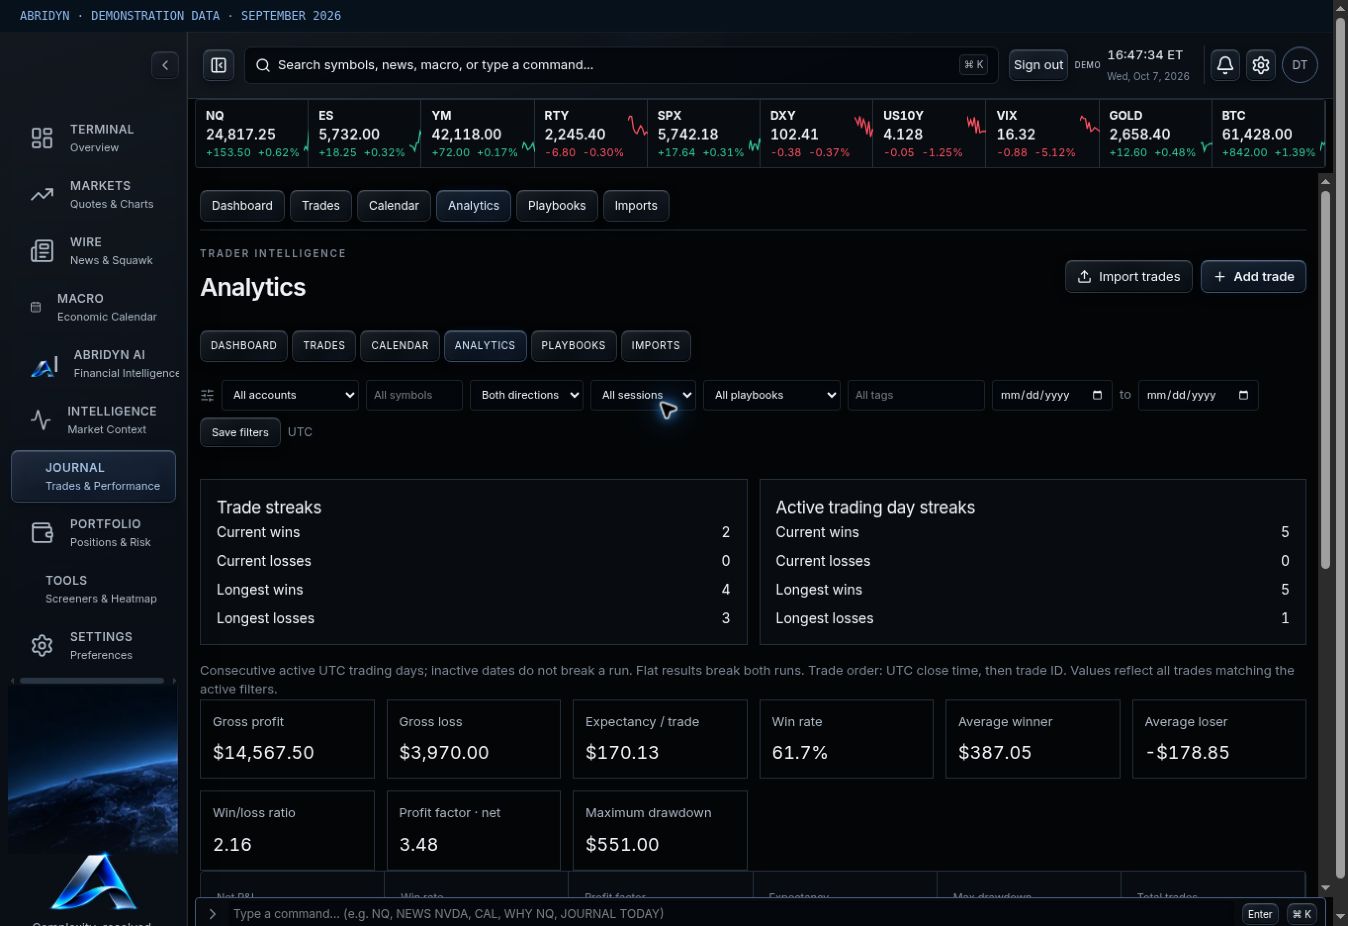
Swipe the image to inspect the details.
Read the whole picture.
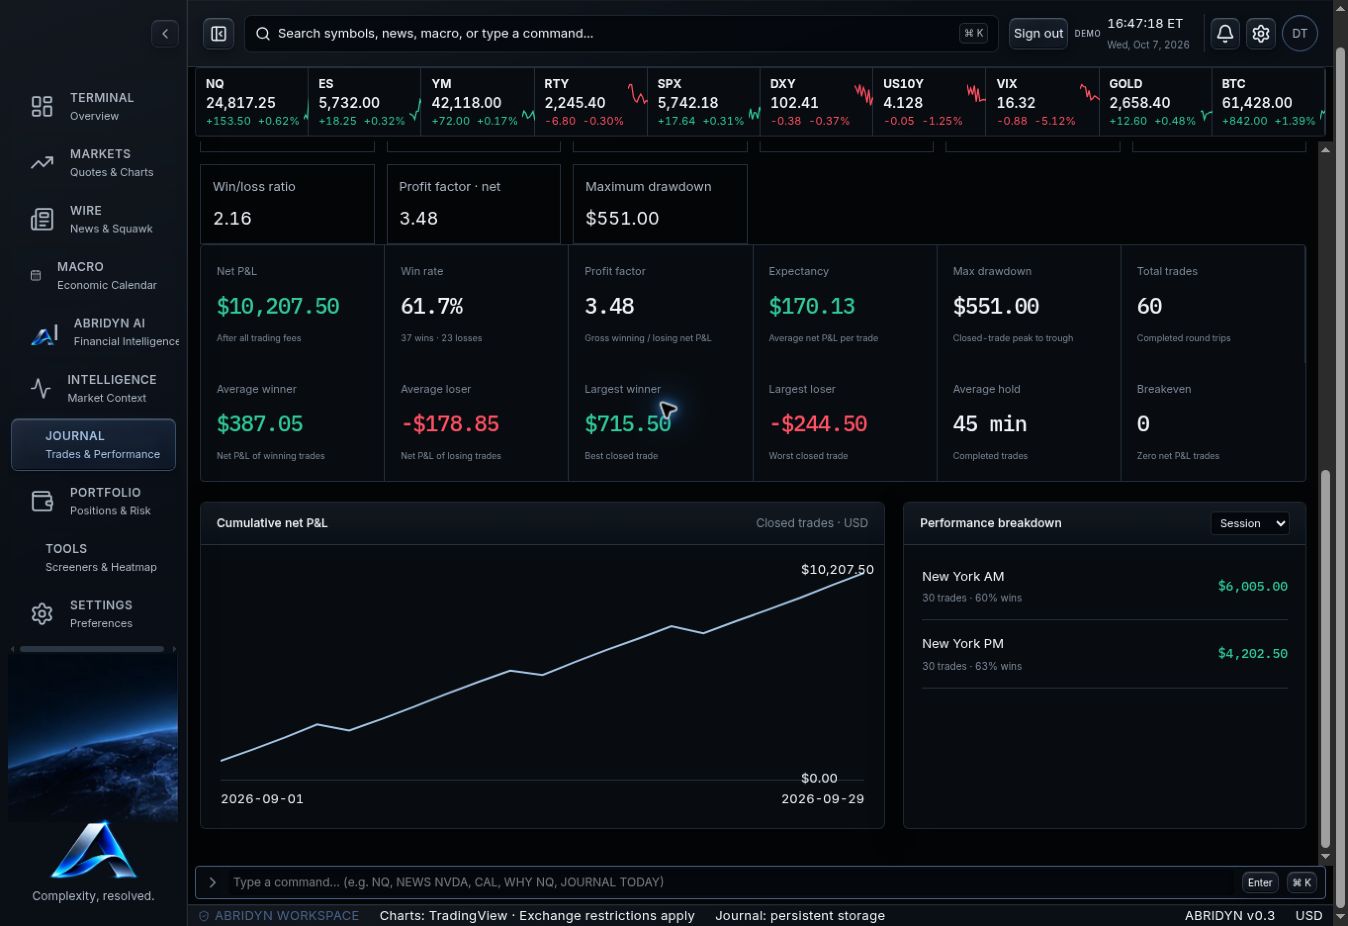
Net P&L shows the result after recorded fees. Expectancy shows your average net result per trade. Profit factor compares positive and negative net results. Win rate sits beside average winner and average loser so you can see how often you win and what each side contributes.
The cumulative curve shows the path of your realized P&L. Daily results and maximum closed-trade drawdown help you see the stretches that built the record and the stretches that gave it back.
| Metric | Use it to review |
|---|---|
| Net P&L | Your result after recorded trading costs. |
| Expectancy | The average net result across your completed trades. |
| Profit factor | The relationship between total net gains and net losses. |
| Closed-trade drawdown | The largest decline from a realized-P&L peak. |
| Trade count | The size of the sample behind the result. |
Swipe the image to inspect the details.
Find the segment that deserves a closer look.
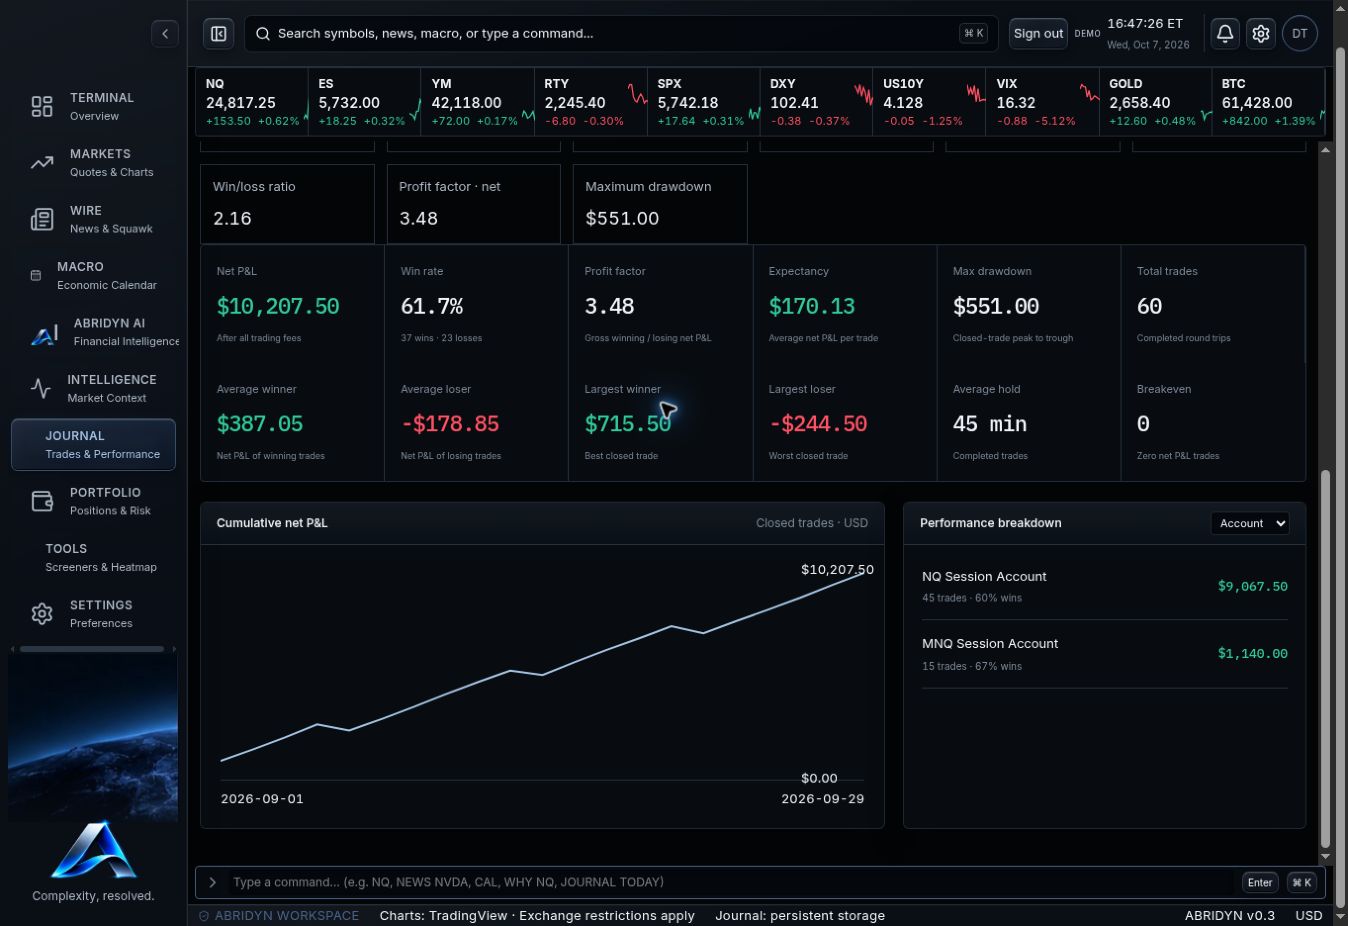
Compare symbols, accounts, directions, sessions and playbooks. Keep the date range consistent, check the trade count and open the records behind the strongest and weakest results.
A useful breakdown gives you somewhere to investigate. If the afternoon is consistently giving back the morning, examine the afternoon trades. If a setup has a strong total, check whether it comes from a broad pattern or one outsized winner.
Swipe the image to inspect the details.
Bring the numbers back to your process.
If win rate rises while P&L falls, look at the size of your losses and your costs. If net P&L is strong but the curve is rough, review the sequence around the drawdown. Compare those trades with the rules and notes you recorded.
The aim is a specific review you can act on: tighten a sizing rule, revisit a setup requirement or check a recurring execution mistake. The numbers tell you where to look. Your trade history supplies the detail.
Common questions.
How is expectancy calculated?
Total net P&L divided by the completed-trade count, including breakeven trades. It describes the history you selected.
What does drawdown measure?
The largest drop from a running peak in cumulative realized P&L, calculated in completed-trade order.
How should I compare small samples?
Check trade count, costs and individual results together. A few trades can move a ratio substantially, so use the breakdown to guide a closer review.
Put your trading routine in one workspace.
Join the Abridyn beta waitlist. Tell us which markets you trade and get updates as invitations become available.
Already invited? Open Beta Tester Access.