BEFORE THE SESSION
Know what is on the calendar.
Check scheduled releases, read the headlines and scan sectors or watchlists. Open the company or macro research that matters to your plan.
Economic Calendar · News · Heatmap · WatchlistsCOMPLEXITY, RESOLVED.

ABRIDYN is a market research terminal and trading journal for active traders and investors. See what ABRIDYN does
One payment gives you personal access to ABRIDYN’s financial terminal, trading Journal and portfolio tools for the life of the service.
Checking the current price…
Secure checkout through Stripe. Look for your setup link by email after payment clears.
Lifetime access lasts for as long as ABRIDYN operates. AI and voice allowances apply. Optional data and third-party services may carry separate fees.
ABRIDYN / FINANCIAL INTELLIGENCE TERMINAL
Research markets in the trading terminal, record completed trades in the trading journal, and use trading analytics to see which setups, sessions and accounts drive your results.
365+ functions and toolsResearch the market. Review your trading. Keep your finances in view.
Charts, company research, options, historical studies and your Journal sit beside portfolio and personal-finance tools. Arrange them once, save the workspace and come back to the work.
Full ELITE access. One payment. Every future platform update. Already registered? Sign in.
Mobile compatible. Use ABRIDYN on your phone, tablet or desktop.
ABRIDYN ACADEMY
Start with your first session, set up your Journal or look up a Terminal command.
Open the AcademyMobile compatible. Use ABRIDYN on your phone, tablet or desktop.
See the scheduled releases, headlines and sector moves together. Build a watchlist and a plan before you get pulled into the session.
Take a lookCompare your setups, sessions and accounts. Open the trades behind a good or bad day and decide what you need to repeat or change.
Take a lookKeep the chart, news and numbers you need together. Save the arrangement so your research is ready when you return.
Take a lookINSIDE THE CURRENT APPLICATION
These screens were captured directly from ABRIDYN on October 26, 2026. Choose a tool or open a screenshot at full size.
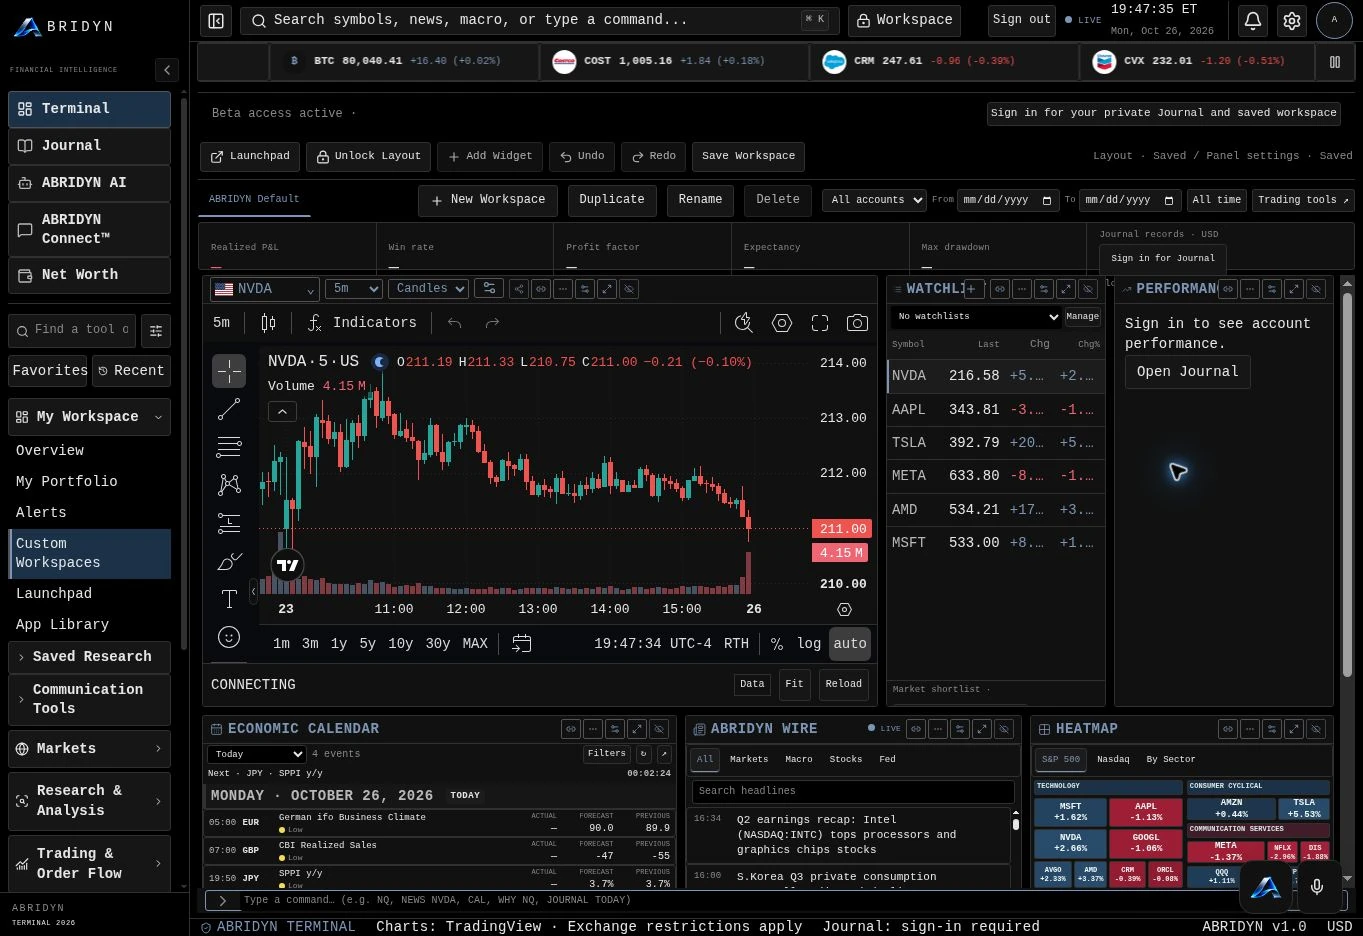
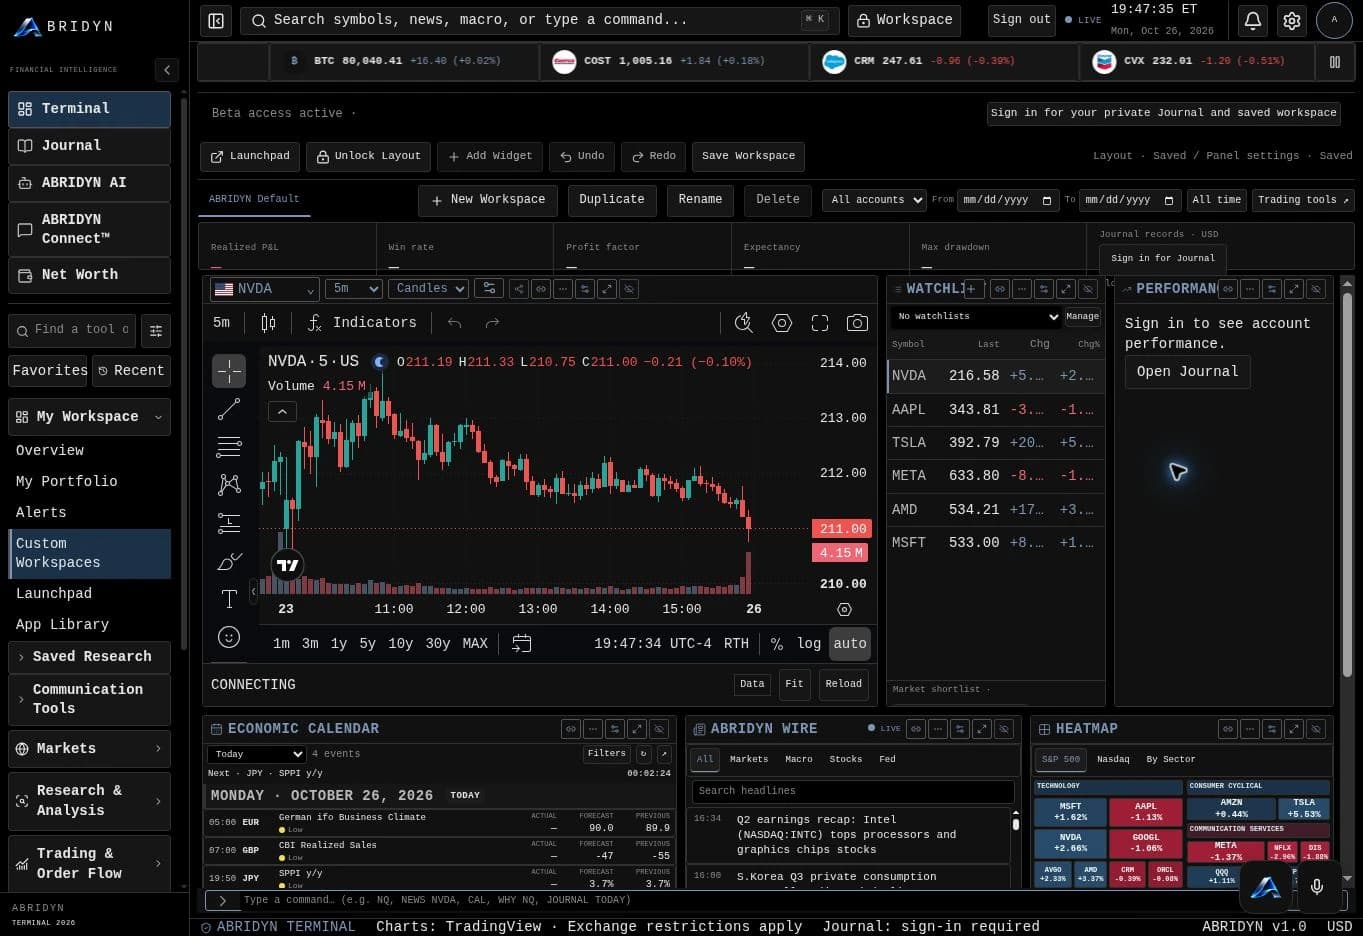
Charts, watchlists and research panels in the current ABRIDYN Terminal. Arrange the workspace around the instruments you follow.
Workspace capture. Private Journal records are not shown; connection states remain visible.WHY I AM BUILDING ABRIDYN
I want my chart next to the news and numbers I am using. When the session is over, I want to open the trades and see what I did well, what cost me money and what needs to change. That is the idea behind ABRIDYN.
Christopher Hunt · Founder, Elite Traders Inc.A NORMAL TRADING DAY
The tools connect around the work: understanding the market, making a plan and checking the record afterwards.
BEFORE THE SESSION
Check scheduled releases, read the headlines and scan sectors or watchlists. Open the company or macro research that matters to your plan.
Economic Calendar · News · Heatmap · WatchlistsWHILE YOU RESEARCH
Read the statement or filing. Compare instruments. Check the source date, work through an options scenario or study the historical session conditions.
Financials · Filings · Options · Correlation · EDGE LABAFTER THE SESSION
Bring in your completed trades, check the daily result and review the decisions. Compare the accounts, setups and sessions you want to improve.
Journal · Performance Calendar · Playbooks · Session Black BoxCOMPANY / MARKET / MACRO RESEARCH
Decide whether an idea holds up beyond the chart. Read the business, compare its results and work through what would have to happen for your valuation to make sense.
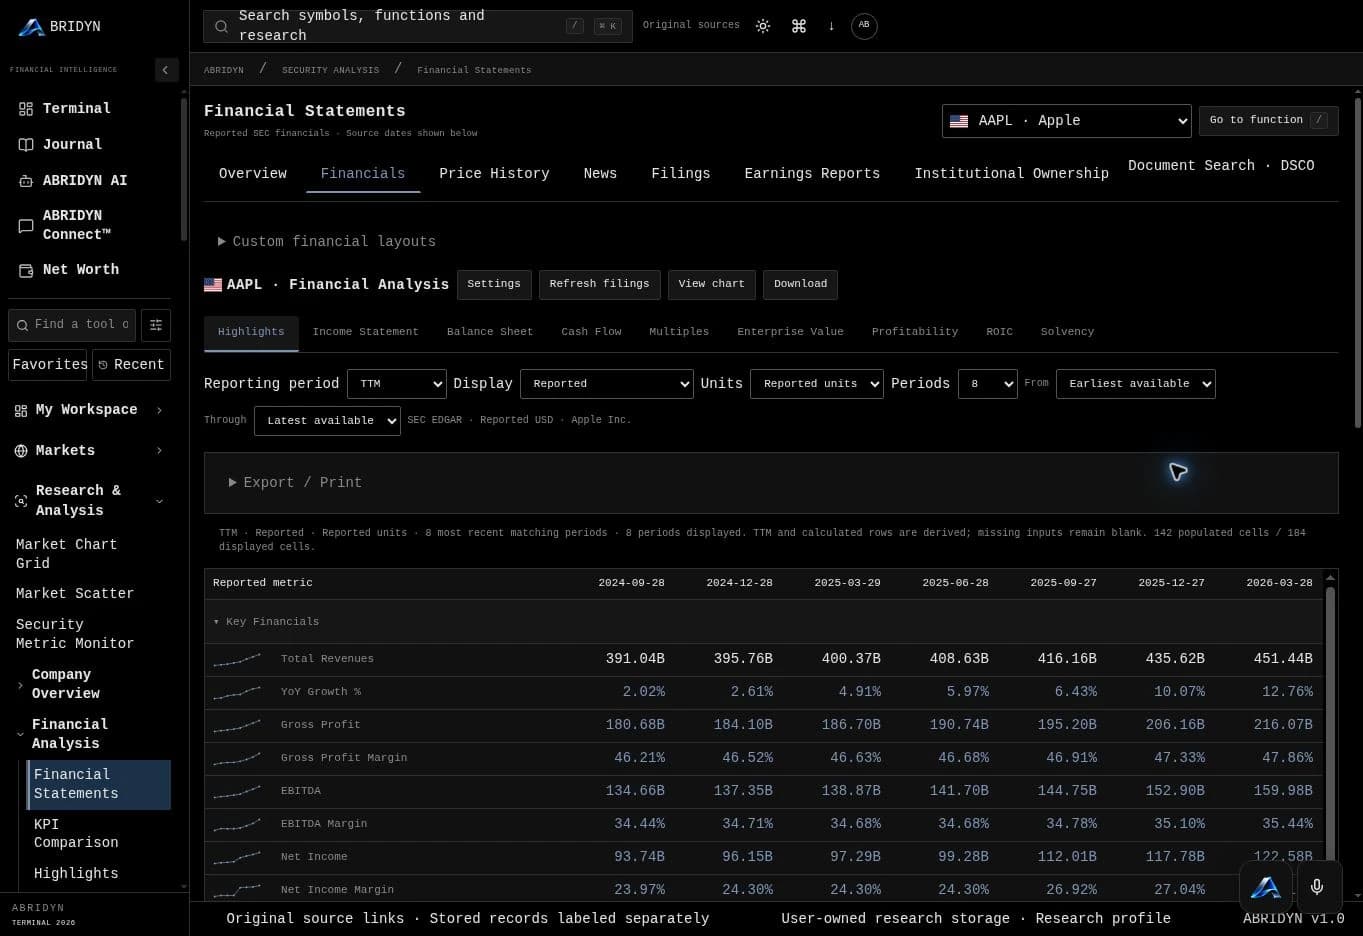
Compare reported periods, inspect cash flow and balance-sheet items, read original filings and test valuation assumptions. Use DCF, reverse DCF and historical multiple views to make the assumptions explicit.
AAPL DESAAPL FAPEBUse heatmaps, screeners, relative rotation, ETF flows and positioning reports to narrow your research. Open the underlying table and check the observation period.
Compare economic series, country observations, energy inventories, oil and gas balances, agricultural supply and infrastructure data. The source, reporting month and unit stay part of the result.
Work through 59 historical research reports covering opening ranges, initial balance, gaps, overnight behavior and other session conditions. Inspect the sample size and distribution behind an outcome.
JOURNAL / ANALYTICS / SESSION REVIEW
A green day tells you the result. The trades tell you how you got there. ABRIDYN keeps completed trades, account scope, notes, screenshots and playbooks together so you can review the detail.
Explore the trading journalPreview CSV imports, check field mapping and assign trades to the right account. Add completed trades manually and return to their executions and notes.
Review net P&L, average wins and losses, expectancy, profit factor, drawdown and the cumulative curve. Use excursion and risk studies when the records contain the required detail.
Open the daily calendar. Compare accounts, symbols, sessions and playbooks. Review A SCORE and keep the plan, levels and risk limits in Session Black Box.
PROP-FIRM FINANCES / NET WORTH
Your trade P&L, prop-firm cash flow and personal net worth answer different questions. ABRIDYN gives each one a place.
Record evaluation fees, subscriptions, resets and payouts. Review what came in, what went out and the difference across your prop-firm activity. Use supported bank connections or enter records manually.
PROP.FINANCESTrack assets, liabilities and changes in net worth. Review the dates behind balances and the status of connected institutions, with manual records available alongside supported Plaid connections.
WEALTHCUSTOM WORKSPACES / LAUNCHPAD
A company-research layout will look different from a session chart or an end-of-day review. Save the arrangement that fits each job.
LAUNCHPAD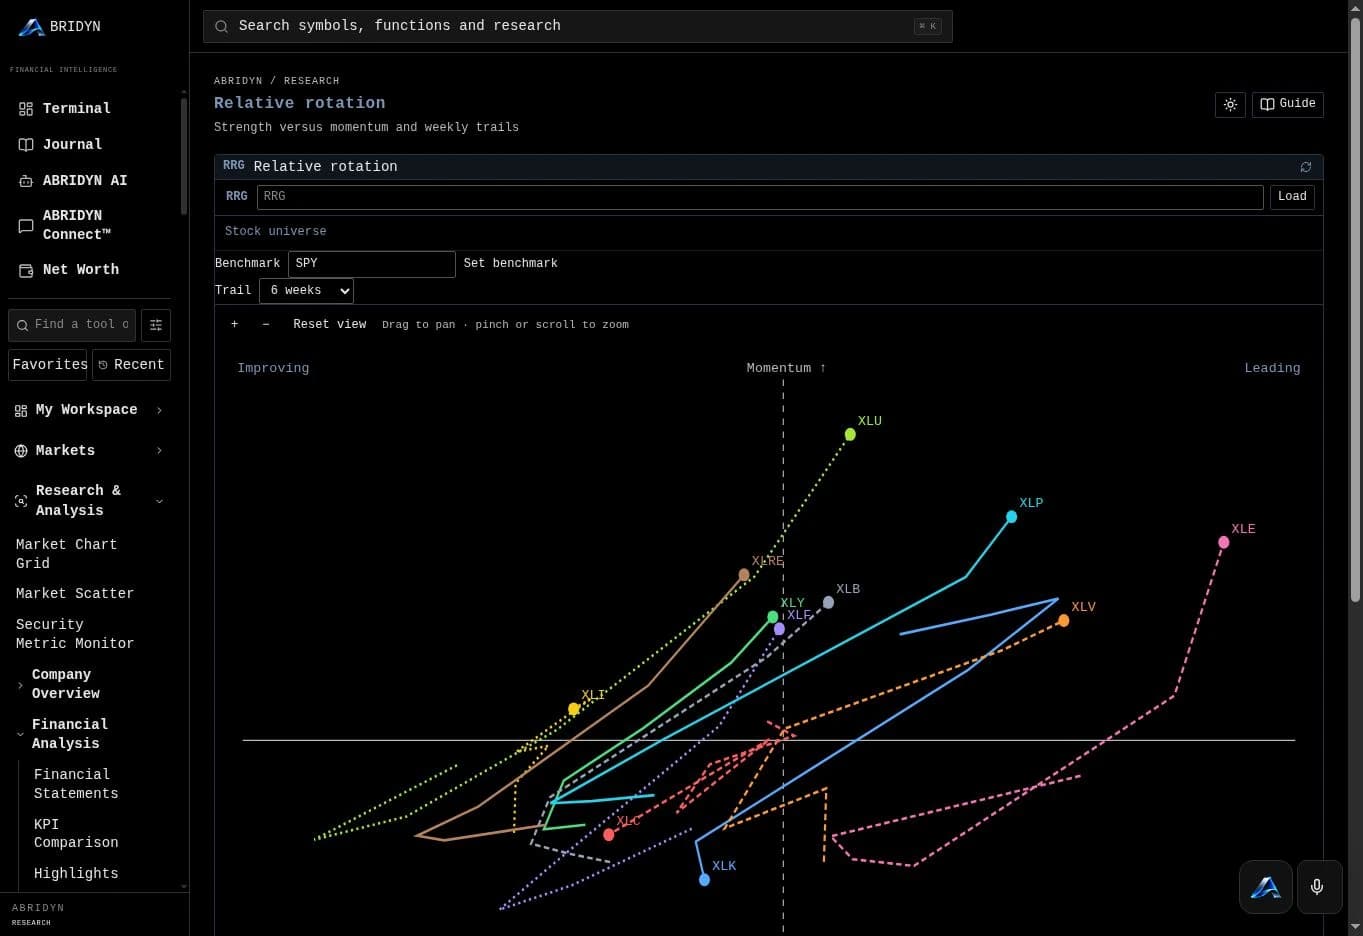
MORE CURRENT SCREENS
Explore the controls, charts and tables you will use. Every image below opens at full size.
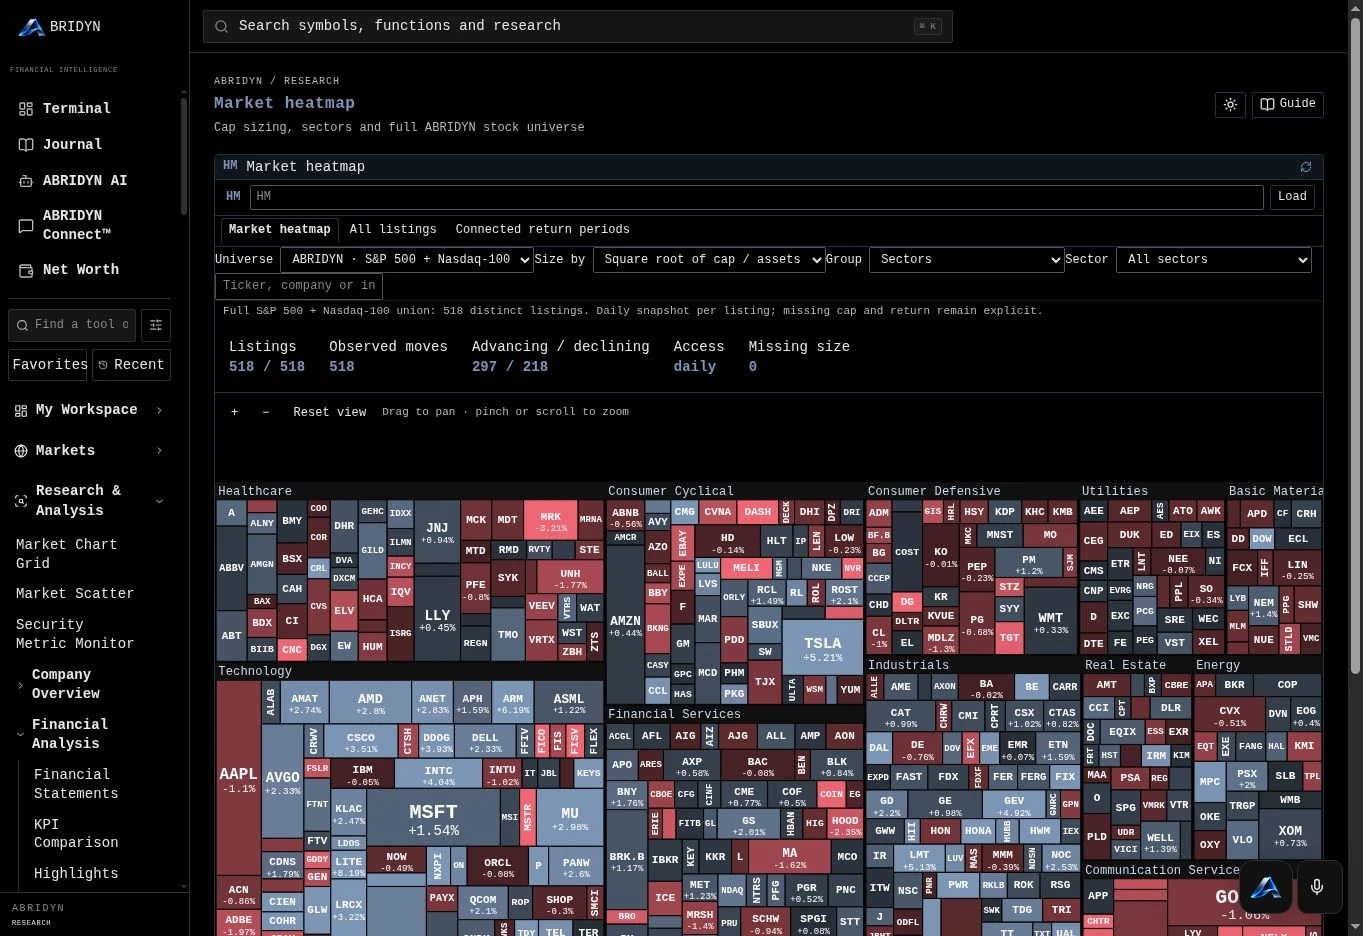
Scan the stock universe by sector and market-cap size. Zoom in to inspect a listing, then use it as the starting point for research.
518 distinct S&P 500 and Nasdaq-100 listings in the displayed daily snapshot.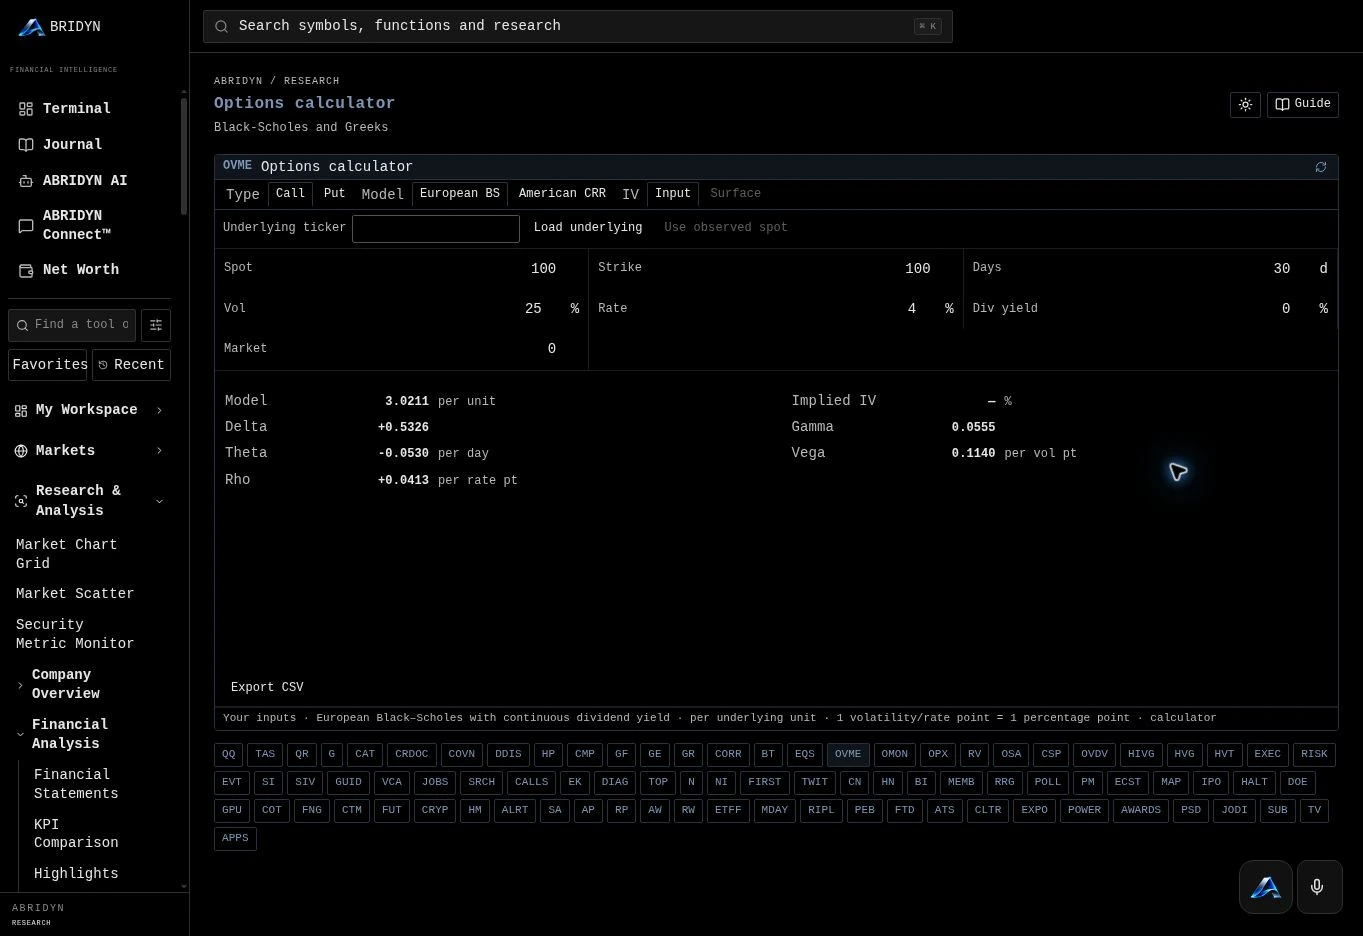
Change the contract and market assumptions to calculate theoretical option value and Greeks. Compare how the output responds to the inputs.
Model output using the displayed calculator inputs; separate from a market quote.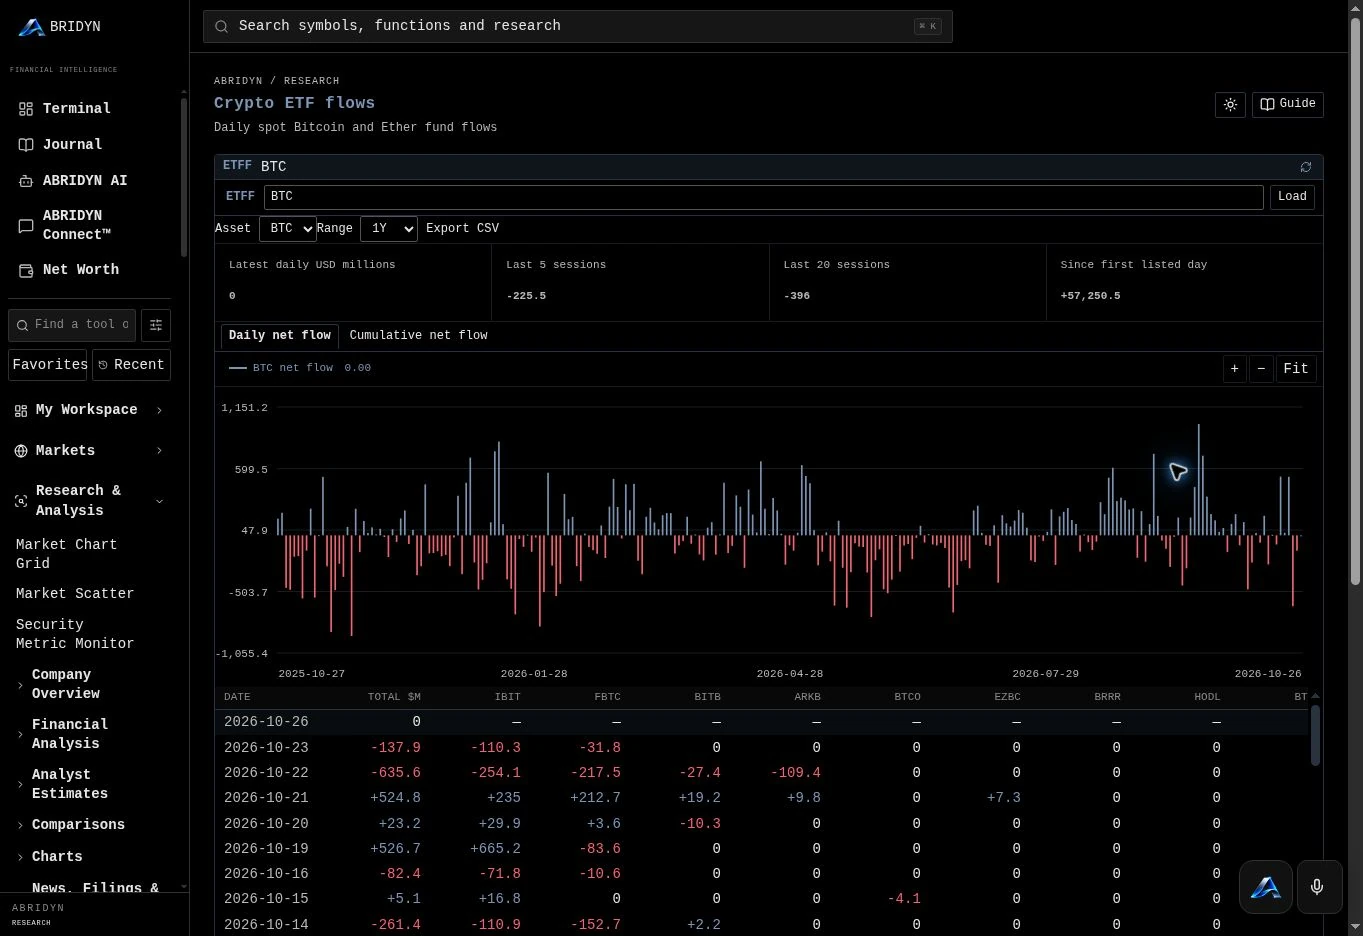
Read daily crypto ETF flows as a chart and a fund-by-fund table. Compare the reported totals and individual funds over the selected period.
Reported publisher observations. Flow amounts, units and pending values are identified in the tool.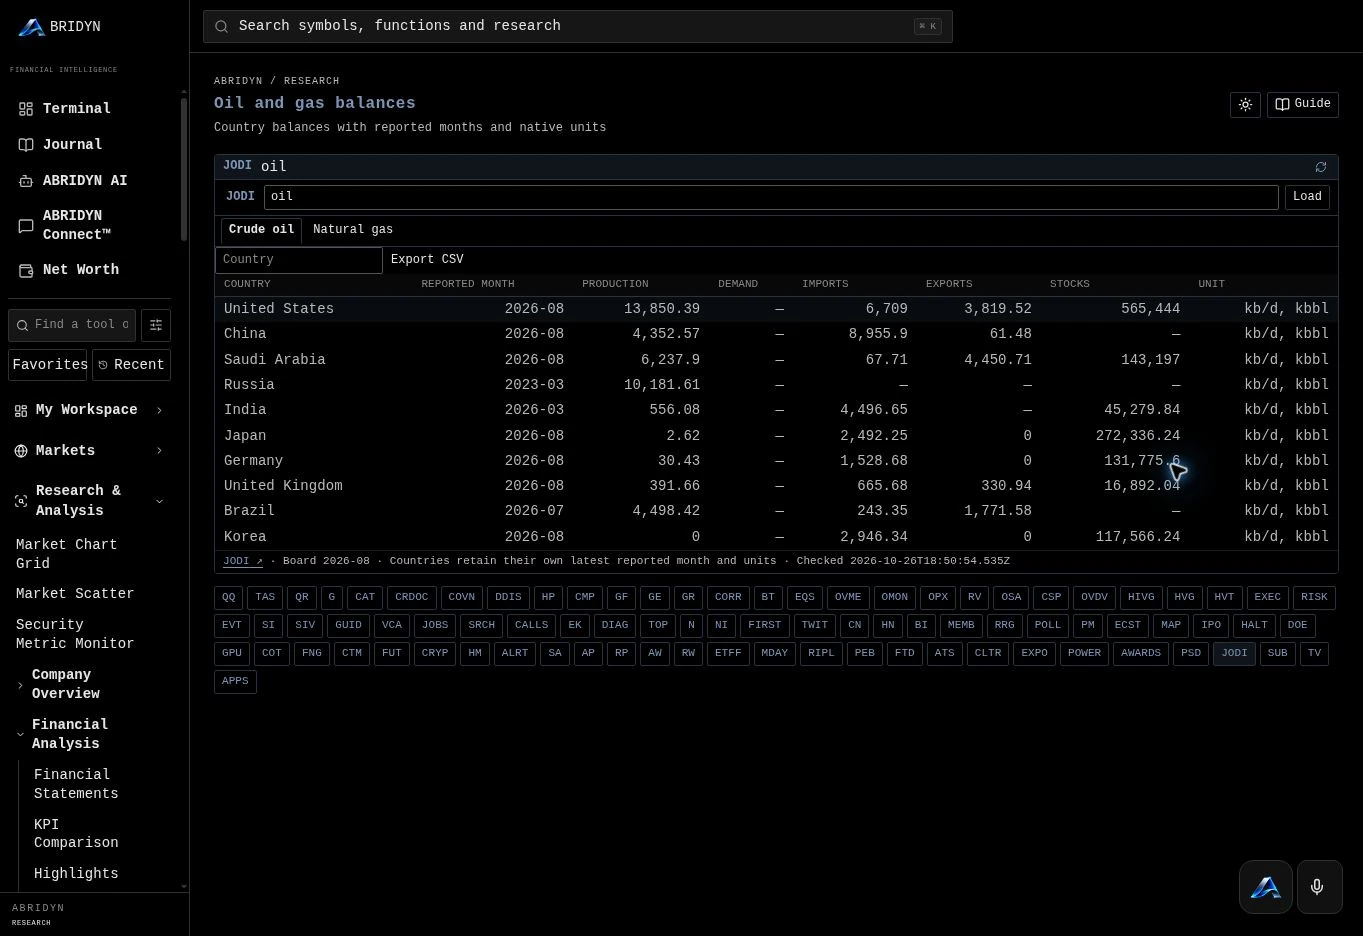
Compare country production, demand, imports and exports. Switch between crude oil and natural gas and export the table for further work.
JODI observations. Countries retain their own latest reported month and native units.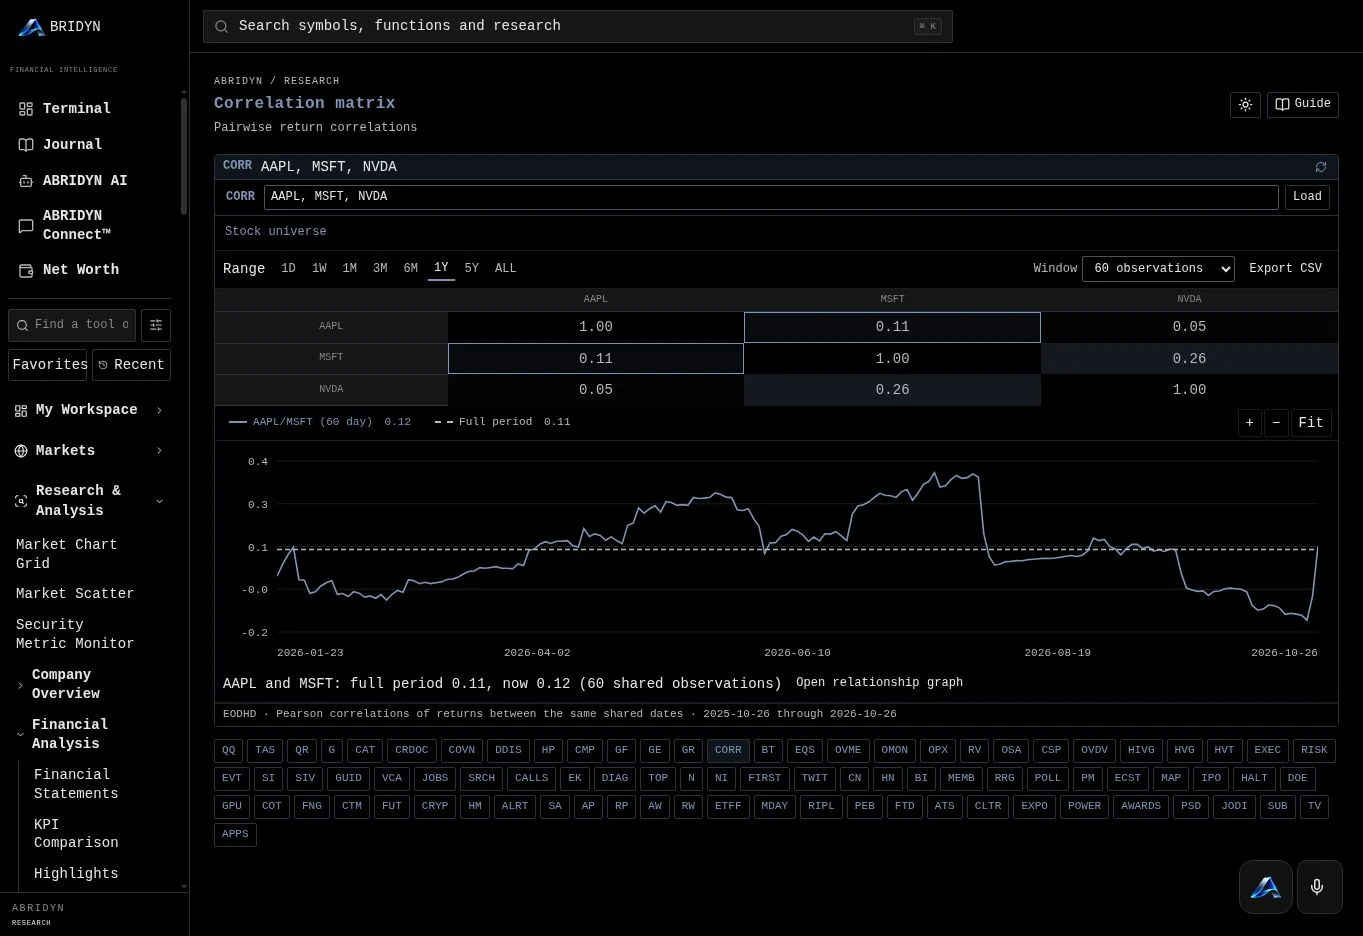
Compare return relationships in a matrix and a rolling chart. Change the instruments, period or observation window to study a different question.
AAPL, MSFT and NVDA. Correlations use returns on shared observation dates.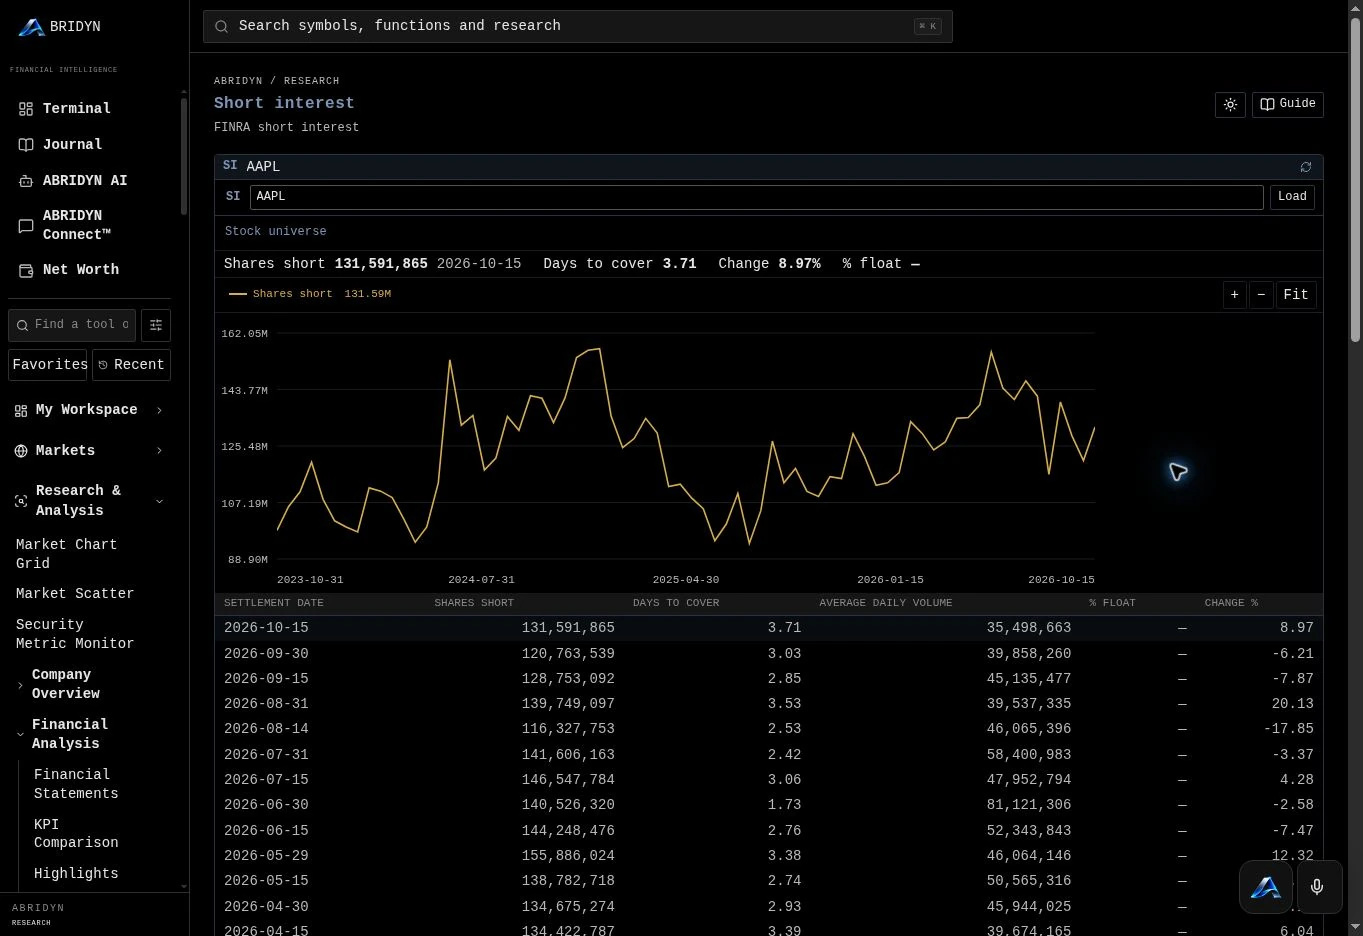
Follow reported short-interest history and inspect the underlying dated records. Keep settlement dates in view when comparing the series.
AAPL short-interest research with source dates and table values visible.WHAT YOU GET FROM ABRIDYN
365+ functions and tools across research, trading review, portfolio analysis, personal finances and workspace controls. Open a category below, or search the full function and command guide ↗.
Understand the business you are researching and decide whether your valuation assumptions hold up. Company statements, estimates, guidance and original filings give you the evidence to work through it.
Compare income statements, balance sheets and cash flow across reported periods. Use annual, quarterly and trailing views where available, with the reporting dates and source kept in view.
Work through discounted cash flow and reverse DCF assumptions, compare multiples and inspect historical P/E bands. Missing earnings or estimates stay visible rather than being treated as known values.
Research company events, supply chains, customers, competitors and related securities where source coverage is available.
AAPL DESAAPL FAPEBSee whether a move is unusual, how instruments behave together and how an idea performed over the history you selected. Use charts, comparisons and return statistics to check the story.
Open supported charts, change the security or period, compare instruments and save useful chart arrangements. Available history and intervals depend on the source.
Build a correlation matrix, inspect rolling correlations and follow the relationship graph. Shared observation dates and the chosen window matter when reading the result.
Use supported backtest and replay tools with the required historical data. Inspect the sample, assumptions and costs before interpreting a result.
GCORRBTUnderstand how price, time and volatility change an options position before choosing the scenario you want to take further. Use chains, volatility studies and model calculations to inspect the trade-offs.
Change the underlying price, strike, expiry, volatility, rates and dividends in the options calculator. Inspect theoretical value and sensitivities; a model value is separate from an executable market quote.
Compare supported implied and realized volatility views, term structures and distributions. Chain, flow and surface coverage depend on the connected options provider.
Explore supported spread and cash-secured put scenarios. Keep contract size, expiry, assumptions and the limits of the available quotes in view.
OMONOPXOVDVGet the context behind a headline and separate a new development from an old story. Publication times, company documents and source links let you check it for yourself.
Browse ranked market stories, company headlines and supported news searches. Open the source and use ticker or category context to narrow the reading.
Find SEC filings and supported company documents, search within the available material and read earnings-call transcripts where licensed coverage exists.
Review earnings, guidance, corporate actions and other supported event views alongside your company research.
TOPNICALLSTurn a broad market into a focused research list. See sector moves, rotation, flows and positioning, then spend your time on the instruments that deserve a closer look.
Explore supported stock and ETF universes, sector groups and market-cap sizing. Use screeners, watchlists and saved screens to return to a useful set of securities.
Compare strength and momentum against a benchmark, inspect weekly trails and read the underlying table. The rotation view identifies its observation period.
Review supported ETF flows, short interest, failures to deliver, off-exchange activity and positioning reports. Settlement dates, publication dates and units differ between these datasets.
HMRRGETFFPrepare for the releases and wider conditions that may matter to your positions. Compare economic observations, rates and positioning before you settle on a market view.
Review scheduled releases and available historical economic observations. Compare the reporting period with the publication date before drawing conclusions.
Explore supported map layers, country drilldowns and market proxies. Annual observations and historical layers retain their own dates.
Open supported rates, currencies, crypto and commitment-of-traders research. Feed access and source coverage determine the fields available.
ECSTMAPCOTUnderstand the supply-and-demand evidence behind an energy or commodity idea. Compare production, consumption, inventories and trade flows instead of relying on the price move alone.
Use supported energy releases and JODI country balances to compare production, demand, imports and exports. Countries can have different latest reported months and native units.
Research supported USDA production, supply and distribution observations. Read commodity, country, marketing-year and unit definitions with the table.
Explore supported power, infrastructure, public-award and related research views. Some sources require configured access or have restricted coverage.
DOEPSDJODIFind which setups, sessions and habits are helping or hurting your performance. Return to the actual trades, execution details, notes and screenshots behind the result.
Preview supported CSV imports, check the mapping and assign records to the right account. Add completed trades manually and organize review by account, symbol, session or playbook.
Review net P&L, win rate, average wins and losses, expectancy, profit factor and drawdown. Available risk and excursion studies depend on the detail in your records.
Use the performance calendar, cumulative curve, A SCORE, notes and playbooks to open the trades behind a result. Account scope and date filters determine which records are included.
JOURNALJCALTRADESGive a setup a historical check and keep a record of the decision you made. Study the conditions and sample behind an outcome, then compare the session with your plan.
EDGE LAB includes focused reports for opening ranges, initial balance, gaps, overnight behavior, event conditions and other session questions. Load the required history before running a study.
Compare conditional outcomes, distributions and sample sizes. A result describes the selected historical observations; changing the instrument, period or condition changes the question.
Use Session Black Box for the plan, important levels, risk limits and review notes. Keep the reasoning available beside the later result.
EDGELABBBOXSee whether payouts cover your prop-firm costs and how your assets compare with your debts. Keep those answers separate from trade-level performance so the numbers stay useful.
Record evaluation, subscription and reset costs alongside payouts. Use supported bank connections or manual records to review what came in, what went out and the difference.
Track supported asset and liability balances and review changes in net worth. Balance dates and connection status help explain how current the view is.
Supported Plaid flows can connect eligible institutions. Manual records remain useful where a connection is unavailable. A payout record and a trade-level P&L record answer different questions.
PROP.FINANCESWEALTHSpot overlapping holdings and concentrations that are easy to miss when reviewing one position at a time. Look through the funds and accounts to understand the exposure.
Review supported fund profiles, holdings, allocations and comparisons. Holdings are tied to their reported dates and may differ from today’s positions.
Explore supported allocation, exposure, performance, correlation and risk views using the records available to the account.
Organize supported client, portfolio and research workflows. Connection-dependent account views keep their own access and coverage requirements.
PORTFOLIOEXPOKeep the information you need in view and spend less time rebuilding the same arrangement. Save research and review layouts, then reopen the workspace for the job.
Move and resize eligible panels, maximize a chart, link compatible widgets by symbol and lock a finished arrangement. Save layouts for different parts of the day.
Add supported functions to a floating pane, arrange their tiles and save named panes. Detach a pane into a browser window for another monitor, then dock it again. Pop-ups must be allowed.
Use favorites, recent functions, research watchlists, graphs, chart templates, saved screens and supported custom-data imports. Each tool retains its own saving and export controls.
LAUNCHPADGet help working through a research question and keep the supporting sources close. Prepare a briefing, ask a follow-up by voice or continue the discussion with other members.
Use the AI workspace or Terminal assistant to work with connected news, calendar evidence and supported account context. Check the sources and timestamps behind an answer.
Enable voice in a supported browser and allow microphone access to use available voice controls while the app is open. AI and voice have their own usage allowances.
CONNECT provides supported member profiles, conversations and document-sharing workflows with their own privacy controls.
AICONNECTPractice an idea, manage supported account connections and organize leader/follower groups from the same platform. Keep the account, connection state and order record visible as you work.
Use supported simulated account and chart-based position controls to practice. Simulated records remain separate from real trade records and never route a real order.
Manage supported account connections and open the execution workspace. Check the connected account, authorization and order status within the relevant provider workflow.
Set up leader and follower groups, configure the supported connection and monitor its status. Keep connection health, account permissions and the order record in view.
VTRADEBROKERCOPIEREach tool shows its own source, dates and data state. Market quotes, reported statements, historical studies, imported trades and simulated practice results should be read in their own context. Your plan, connected services and account permissions determine access.
Read the full platform guideTRY THE PLATFORM
Compare the subscription plans. The current screenshots above give you a look inside before you join.
Compare the plans and included tools. After payment through Stripe, use your account-setup email to create your login.
Compare plansComplete checkout, open your account email and create your password. Your membership unlocks the tools you chose.
Choose a planNeed help? Join our Discord or call 949-427-1351.
Already purchased? Recover your access or sign in.
ABRIDYN is a browser-based financial intelligence terminal. It brings together charts, company and market research, options tools, historical studies, a trading Journal, portfolio analysis, personal finances, AI and member communication. You can arrange the tools into saved workspaces for the way you work.
Company financials, valuation, filings, news and earnings calls; stock and ETF scans; options and volatility; economic releases, rates, energy and agricultural data. Use the full function guide to find a tool by name, task or command.
Import a supported CSV, check the mapping and preview, and choose the account. You can also add completed trades manually. Review the daily calendar, net P&L, cumulative curve, A SCORE and trade details, then compare the accounts, symbols, sessions or playbooks that matter to you.
The Journal reviews completed trades and trading performance. Prop Firm Finances records payouts and costs such as evaluations, subscriptions and resets. Net Worth gives you a separate view of assets and debts.
Use Broker Connections for supported account links and the execution workspace for its account controls. COPIER provides leader and follower setup and connection monitoring. Check the connected provider, authorization and account status in the relevant workspace.
Open ABRIDYN AI or the microphone beside its launcher, enable voice and allow microphone access. Say Hey ABRIDYN while the app is open. The listening waveform confirms activation. Voice support depends on your browser and device, and does not stay active after you leave or lock the app.
Yes. Arrange supported panels in your workspace, or add functions to a Launchpad pane. Detach the pane into a browser window, move it to another monitor and dock it again when you are finished. Allow browser pop-ups for detachment.
Choose a plan and complete payment through Stripe. Open the account-setup link in your email to create your login, then set up a supported passkey or Face ID if you want to use it.
Yes. ABRIDYN adapts to desktop, tablet and mobile. You can review research and trading records on your phone, then return to your desktop workspace.