
Start with a net result for each trade.
Use six example completed trades: $100, −$60, $40, −$20, $0 and $80, in exit order. Fees are already included. Together they produce $140. These are demo inputs to explain the math.
Use the same net-result series for each metric. If one includes fees and another excludes them, the numbers are answering different questions. Keep the currency and trade-count convention consistent too.
Expectancy: what did an average trade produce?
Divide total net P&L by completed-trade count. In this example, $140 ÷ 6 = $23.33 per trade, rounded to cents. The breakeven trade stays in the count. This is how Abridyn calculates expectancy from your selected history.
It is a useful description of the sample. Check the number of trades and the larger winners and losers before treating the average as representative. Dollar expectancy is also different from expectancy measured in units of initial risk.
Profit factor: how did gains compare with losses?
The positive results add up to $220. The absolute negative results add up to $80. Profit factor is $220 ÷ $80 = 2.75. The breakeven trade adds to neither sum. Win rate is three profitable trades out of six, or 50%.
Check the denominator when reading the ratio. With no losses it has no finite value. When gains and losses are both zero, it is mathematically undefined; Abridyn uses 0 as the empty or all-flat display placeholder. Neither case gives you evidence about future losses.
Drawdown: how much did the curve give back?
Starting at zero, cumulative realized P&L is $100, $40, $80, $60, $60 and $140. The largest drop from a prior peak is $100 down to $40. Maximum closed-trade drawdown is therefore $60.
Abridyn uses the running realized-P&L peak, including the starting zero baseline. This measures the completed-trade sequence. Continuously marked brokerage equity can produce a different drawdown because it also includes changes while positions are open and account cash movements.
| Metric | Calculation | Example result |
|---|---|---|
| Net P&L | 100 − 60 + 40 − 20 + 0 + 80 | $140 |
| Expectancy | 140 ÷ 6 | $23.33 per trade |
| Profit factor | 220 ÷ 80 | 2.75 |
| Closed-trade drawdown | 100 − 40 | $60 |
Use the number to find the next question.
A ratio is a starting point. Open the underlying records and look at sizing, costs, distribution and the sequence of trades. That is where a useful review becomes specific.
When comparing software, check the definitions first. Fee treatment, breakeven trades, date boundaries and drawdown methods can change a displayed metric even when the source trades are the same.
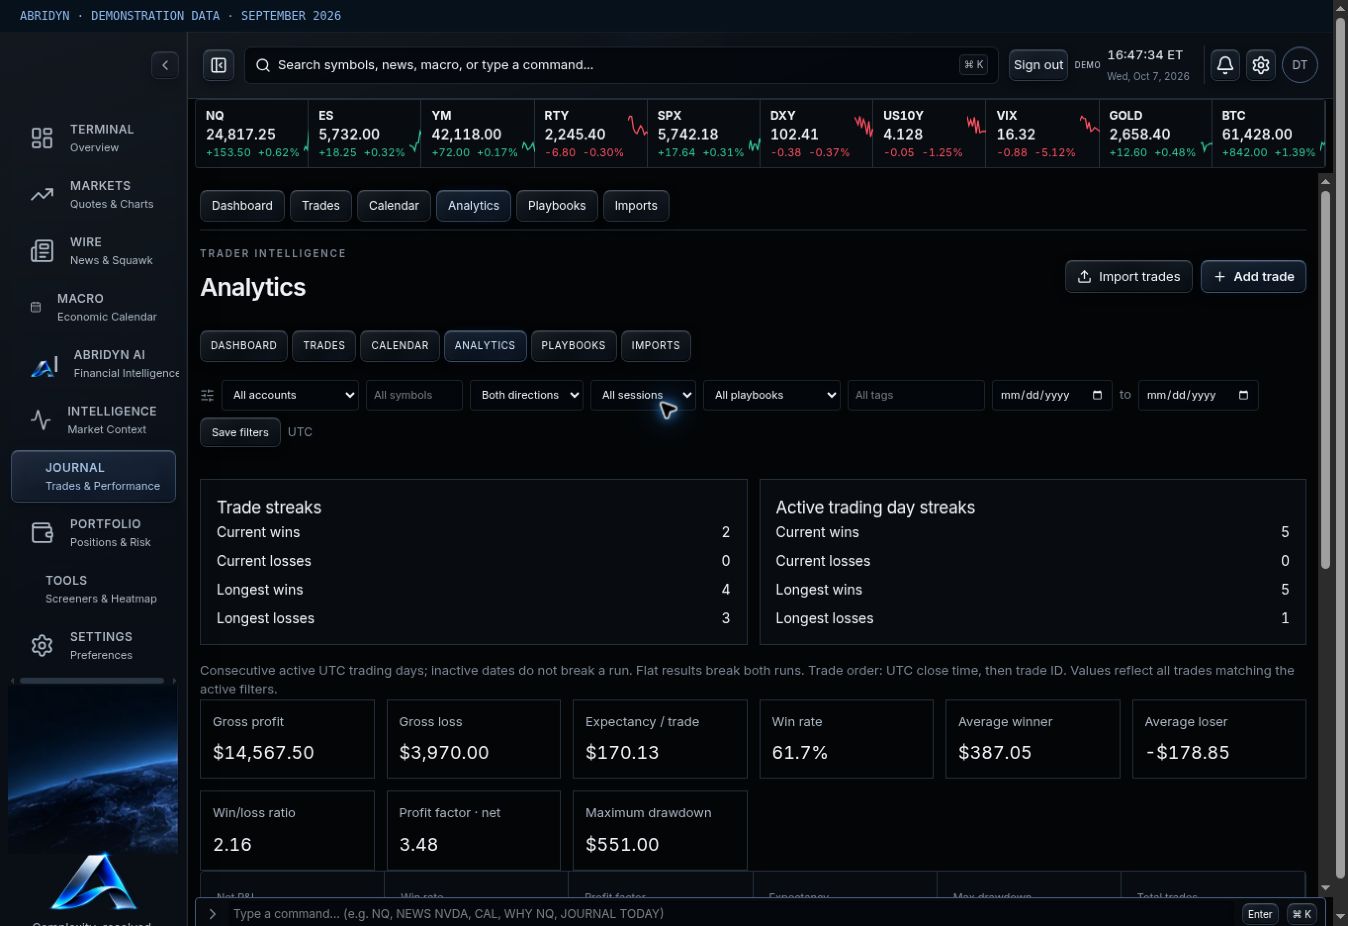
Swipe the image to inspect the details.
For education and trade review. Examples use demonstration data.