
Review the points. Understand the dollars.
For a Nasdaq futures trader, the session, contract size and execution matter as much as the final number. Abridyn keeps those details with your NQ and MNQ records so your review reflects the way you actually traded.
Request beta access ↗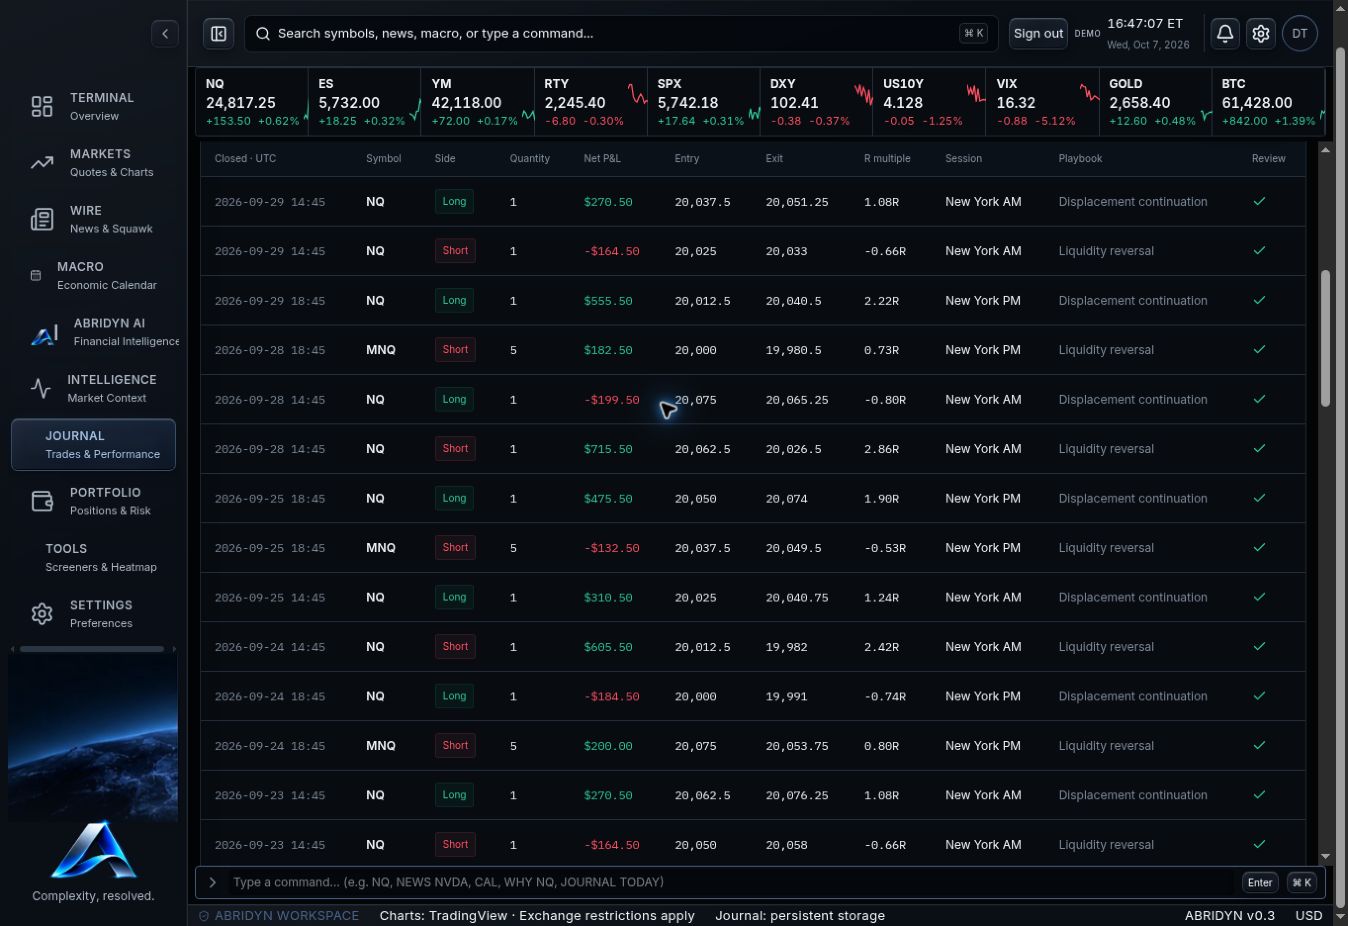
Swipe the image to inspect the details.
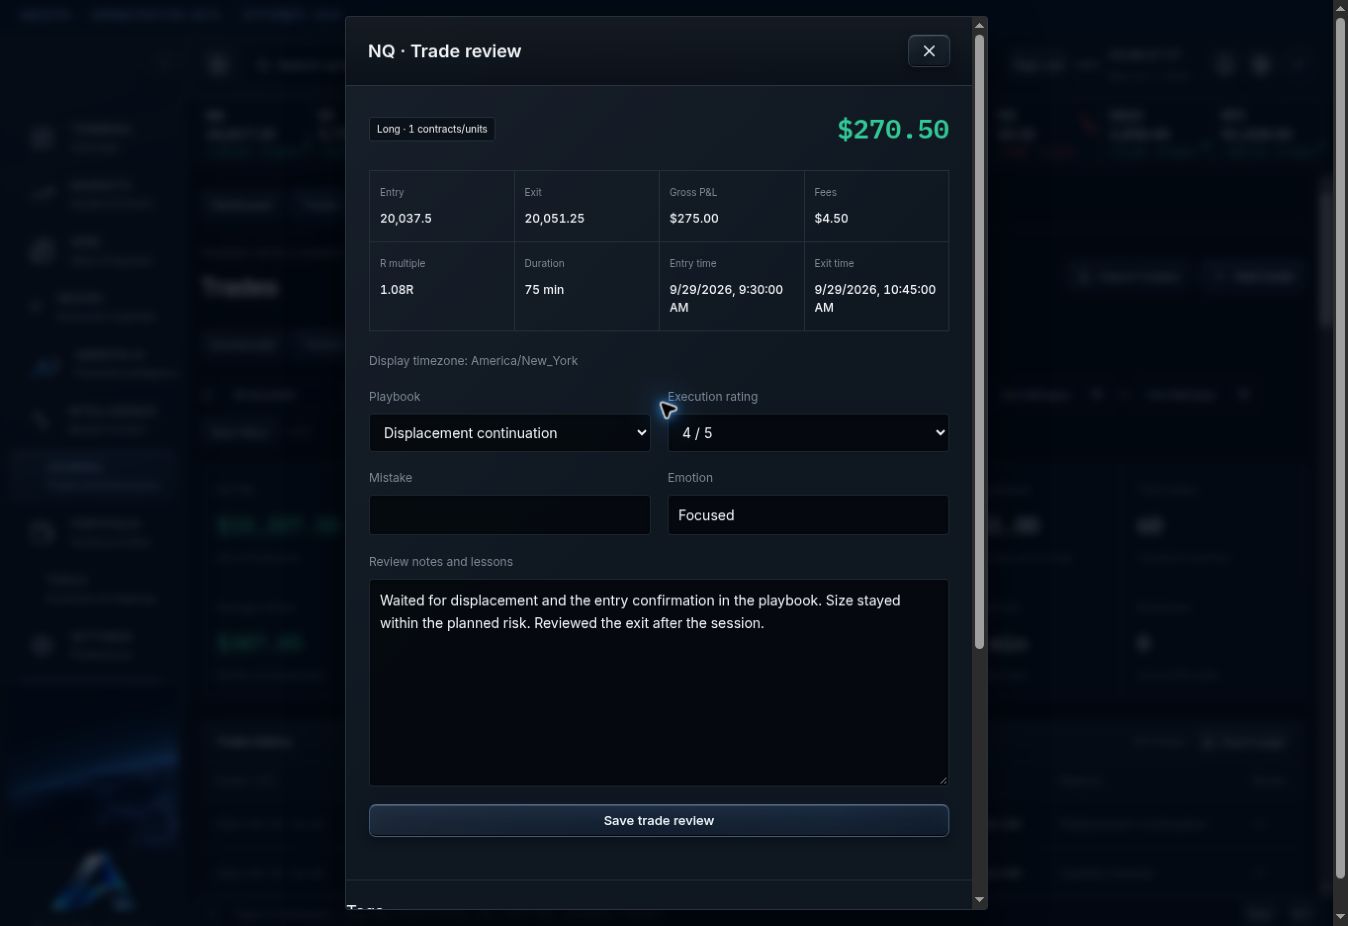
Keep the contract size attached to the result.
NQ is $20 per index point; MNQ is $2 per point. Both use a 0.25-point minimum outright tick, worth $5 in NQ and $0.50 in MNQ per contract. Check quantity and multiplier during CSV upload so the record carries the correct dollar exposure.
A 10-point move on one contract is $200 in NQ or $20 in MNQ before costs. Review the price move, number of contracts and fees together.
| Contract | Value per point | Minimum outright tick | Value per tick |
|---|---|---|---|
| NQ | $20 | 0.25 points | $5 |
| MNQ | $2 | 0.25 points | $0.50 |
Swipe the image to inspect the details.
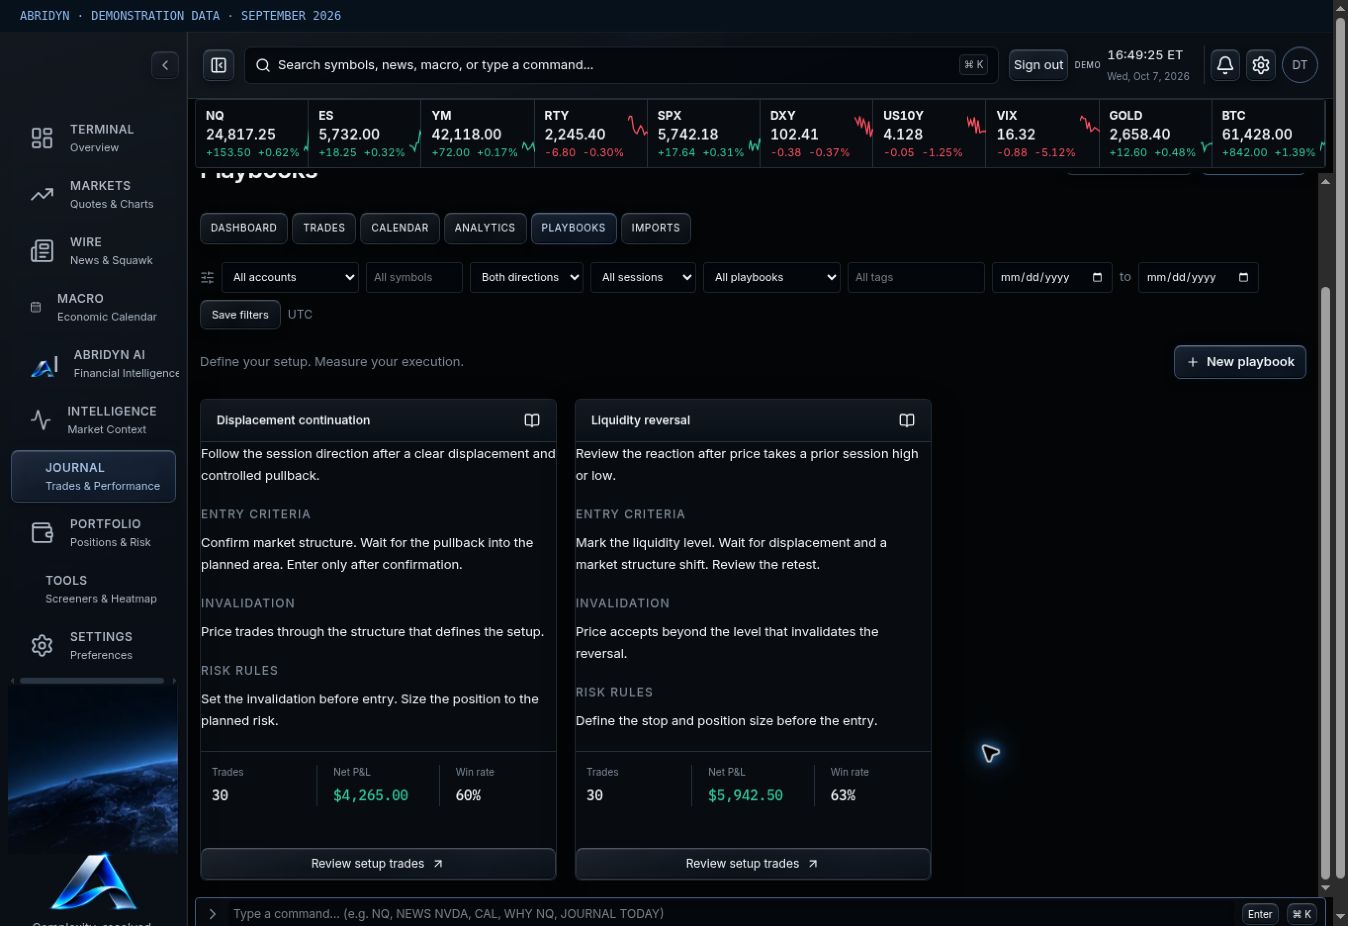
Review the session you actually trade.
Filter by NQ or MNQ, select your session and compare the playbooks behind the results. Look at net P&L, expectancy, trade count and the sequence of wins and losses.
If the morning performs well and the afternoon gives it back, open those afternoon trades. The most useful answer is usually in the entries, exits, sizing and notes—not the total alone.
Swipe the image to inspect the details.
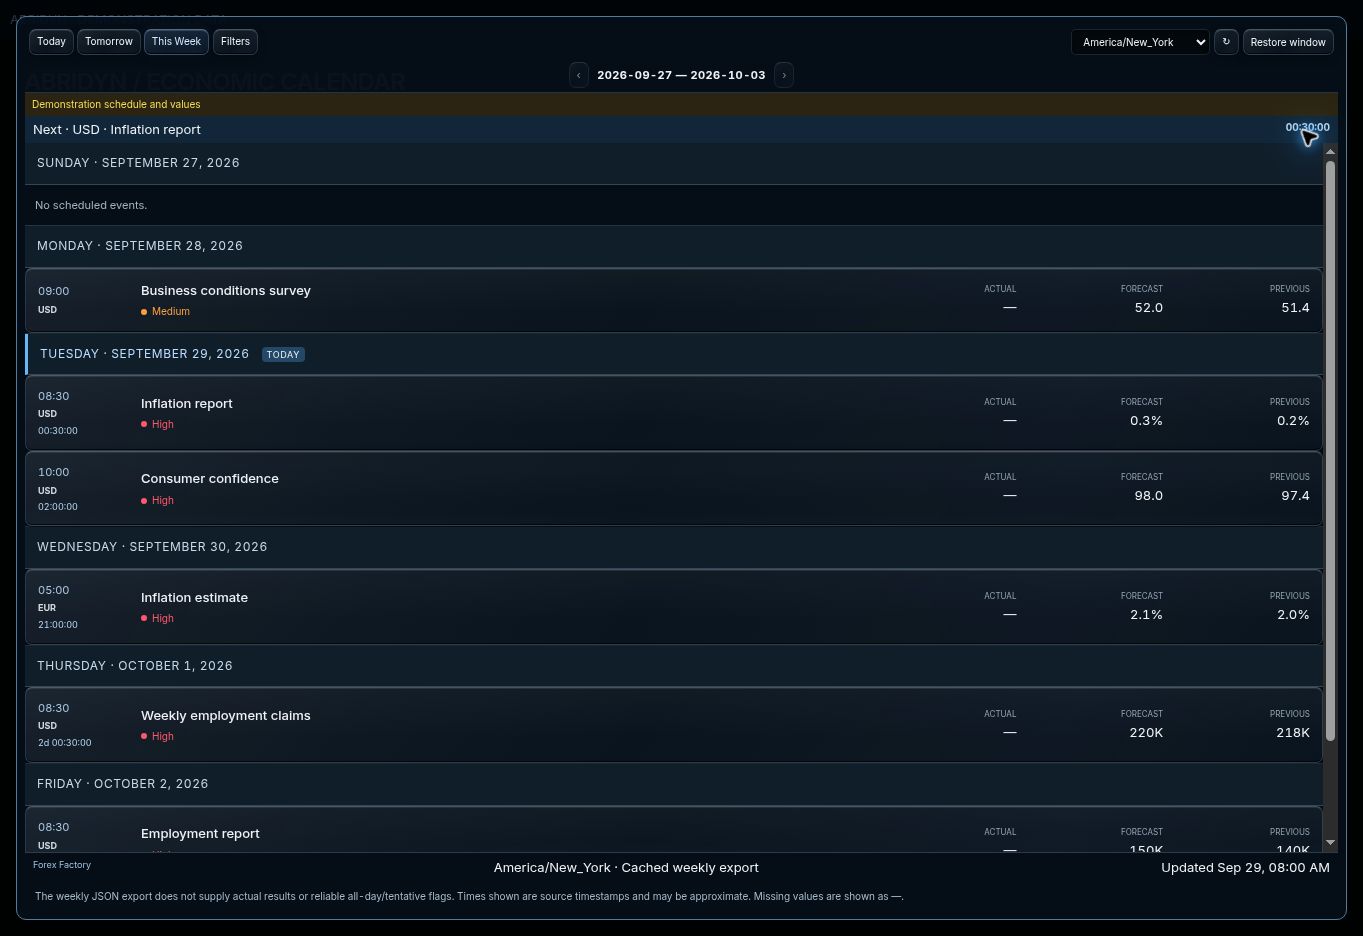
Keep the schedule in your preparation.
Use the economic calendar before the session to identify scheduled macro releases. Note the risk window in your plan and keep the execution timestamps with the trade.
During review, compare what you planned with what you did around the event. Consistent session labels and notes make the next weekly review easier to work through.
Swipe the image to inspect the details.
Contract specifications: CME NQ and CME MNQ. Verified October 7, 2026.
Common questions.
Can I journal both NQ and MNQ?
Yes. Keep the symbols, quantities, multipliers and fees correct during CSV upload, then review each instrument with the Journal filters.
Why compare points and dollars?
The contracts have different dollar multipliers. Looking at both helps you distinguish the price move from the size you traded.
Put your trading routine in one workspace.
Join the Abridyn beta waitlist. Tell us which markets you trade and get updates as invitations become available.
Already invited? Open Beta Tester Access.