
Make the records comparable first.
Shares, contracts, forex lots and crypto quantities use different conventions. Keep the instrument, quantity, point value and account currency with the source record. Confirm the net result before combining it with another market.
Prepare a consistent USD basis for Abridyn’s supported Journal fields. Check each CSV mapping rather than assuming the same multiplier or quantity convention works across instruments.
Know which costs are in the result.
Stock-trade P&L, forex financing and crypto funding can represent different parts of an account’s performance. Record the costs included in each completed result and retain the source statement for the other detail.
Your trade review answers questions about completed execution. A full investment-return or tax calculation has a wider scope. Keeping that distinction clear makes the Journal more useful.
Compare the way you traded.
Use symbols, accounts and playbooks to separate the records. Choose the same period and review trade count, exposure and costs alongside net P&L. Different totals can come from different sample sizes or position sizing.
Then ask the process questions: did you follow the setup, prepare for the session and manage size consistently? Those questions transfer across markets better than a ranking based on one week’s dollars.
Keep the filters useful.
Use consistent labels so you can find the same setup or behavior again. If two records do not share a reliable accounting basis, review them separately until they do.
Abridyn’s account and symbol filters keep the comparison focused. When a total looks surprising, return to the trades and check the source records before drawing a conclusion.
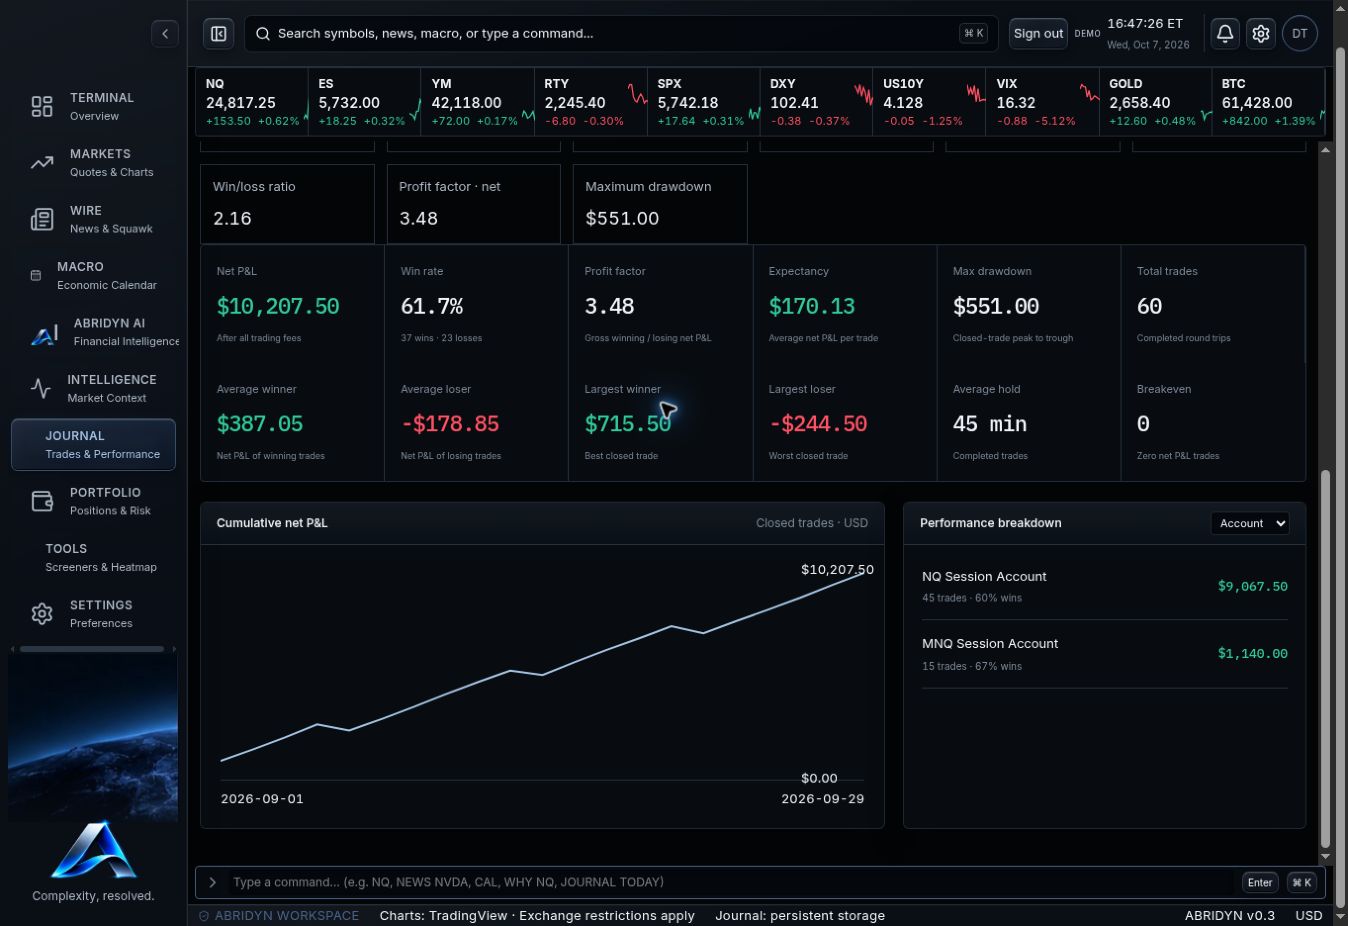
Swipe the image to inspect the details.
Sources and further reading.
Sources checked October 7, 2026. Abridyn examples follow the calculations used in the Journal.
For education and trade review. Examples use demonstration data.