
Know the contract behind the number.
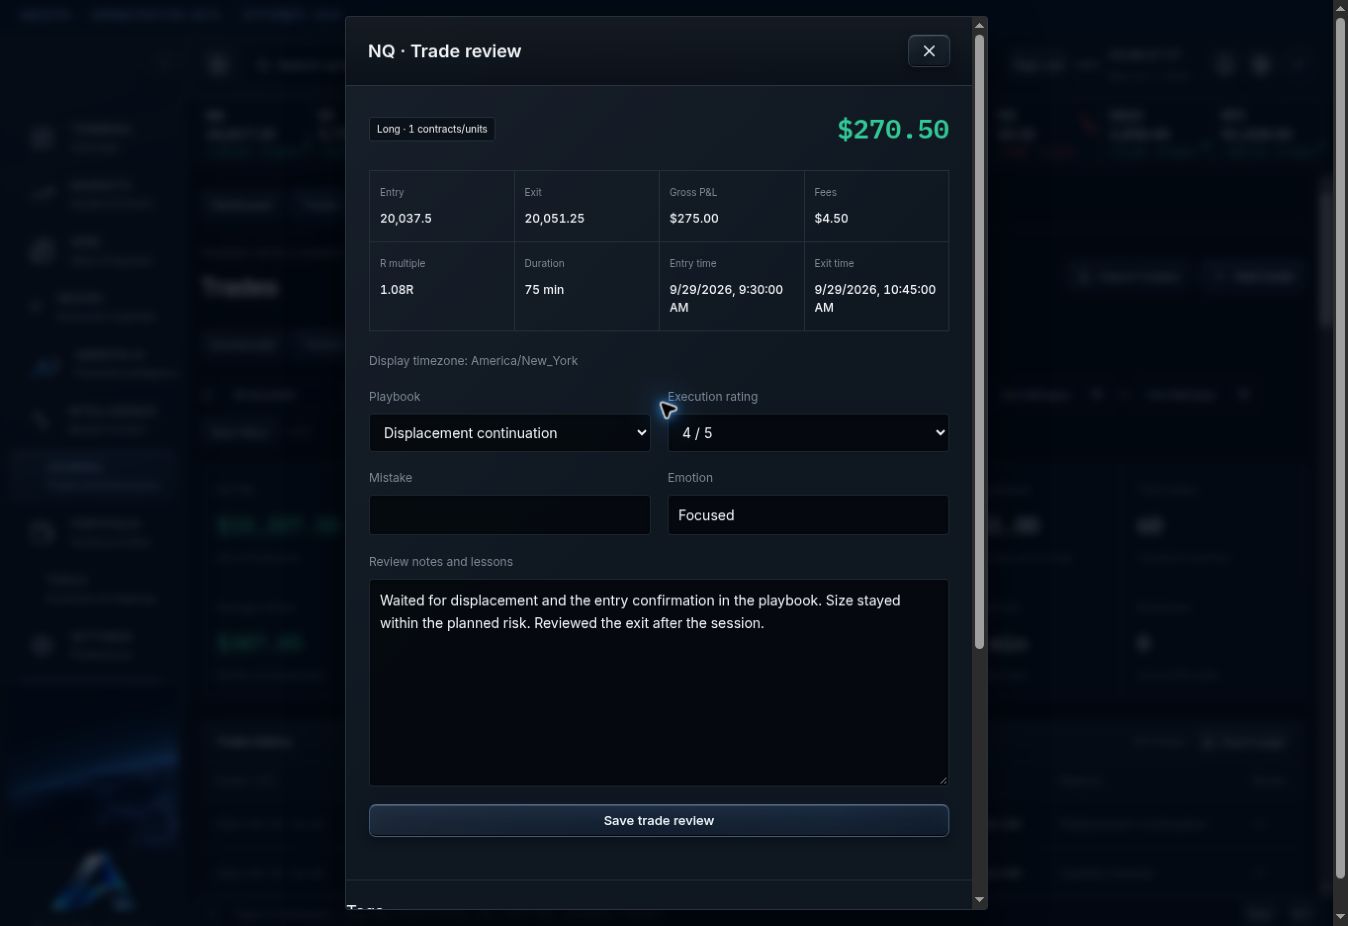
NQ is $20 per Nasdaq-100 index point. MNQ is $2 per point. Both have a 0.25-point minimum outright tick: $5 per NQ contract and $0.50 per MNQ contract. Keep the actual contract identifier from your statement and check current specifications with CME.
For one long contract, an entry at 20,000 and exit at 20,010 produces $200 gross in NQ or $20 gross in MNQ. Two contracts double that amount. Subtract recorded fees for the net result. For a short, reverse the price difference.
Separate the move from the size.
A larger NQ winner can come from the multiplier alone. Review points, quantity and costs before judging the dollar result. If you compare results relative to risk, use the initial risk you recorded rather than guessing it from the final loss.
During CSV upload, check the quantity and multiplier mappings. In the Journal, filter NQ and MNQ separately, then compare the sessions and playbooks you actually traded. Preserve contract-expiry and rollover detail in your source records.
Swipe the image to inspect the details.
Review your decisions around the release.
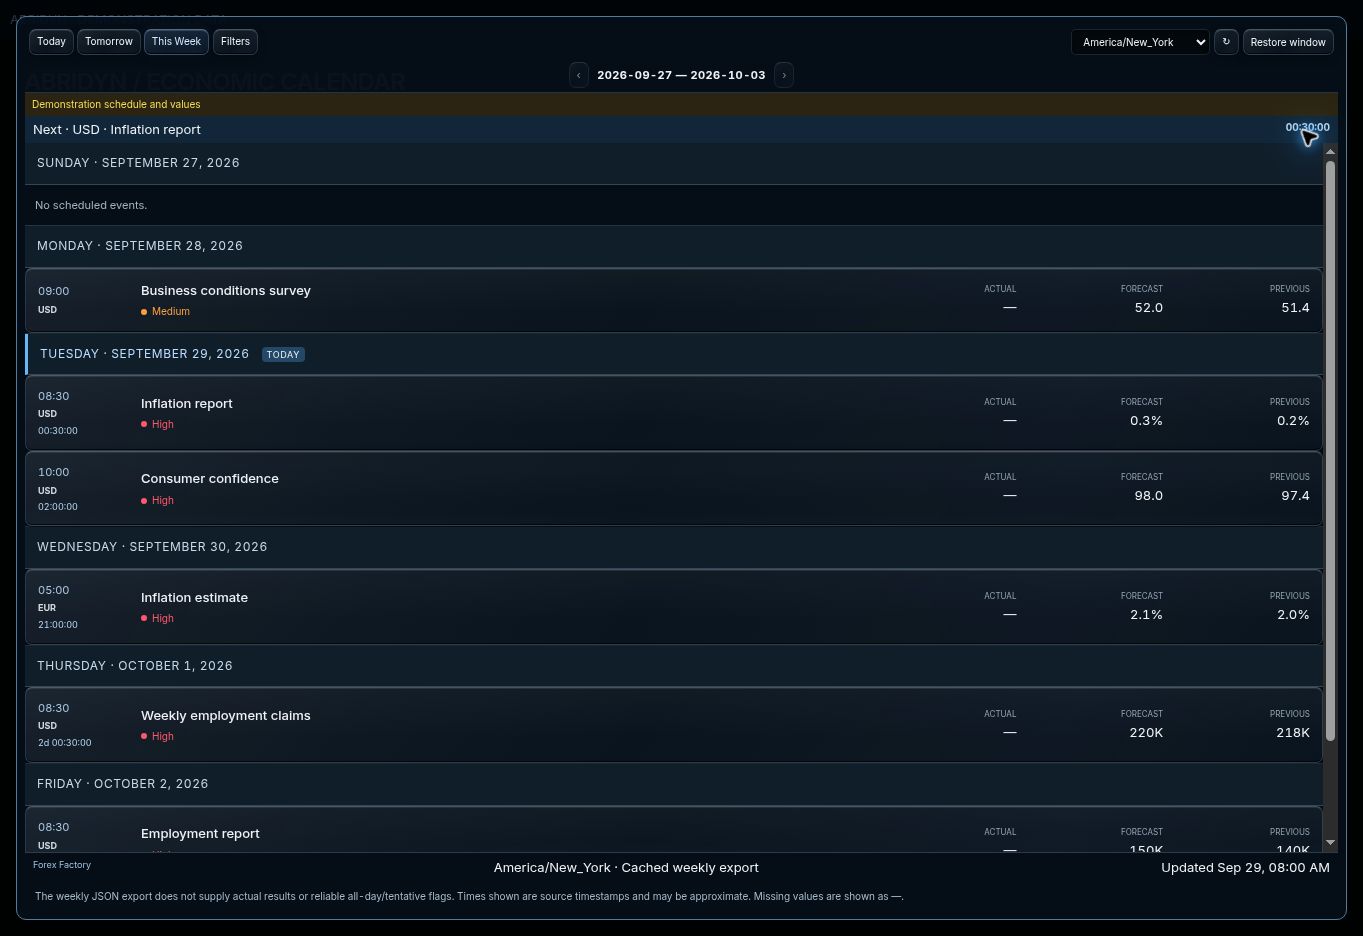
Before the session, identify the macro events on the calendar and record the risk window in your plan. After the session, compare the execution timestamps and notes with that plan.
Did you enter when you said you would wait? Did you change size around the event? Those are decisions you can review. A nearby headline or release gives context; the timing alone does not explain the trade’s result.
Swipe the image to inspect the details.
Check costs and session dates.
Fees can take a meaningful share of a small MNQ result. Check the export’s cost convention and make sure the same fee was not included twice.
Abridyn’s daily completed-trade analytics use UTC exit dates. Your broker may use a different futures session day. Match the timestamps before comparing daily totals.
Sources and further reading.
Sources checked October 7, 2026. Abridyn examples follow the calculations used in the Journal.
For education and trade review. Examples use demonstration data.